For my final project in Data and Programming for Public Policy II, I study whether household internet access impacts American school-age students’ test scores. Given the uptake in remote learning methods during the pandemic, I posit that states or cities with greater shares of households with internet access would also have less extreme declines in test scores from 2019 to 2022.
A summary of each project component is below:
Data Wrangling
I analyze the change in average test scores between 2019 and 2022, a measure which has been reported as an indicator of negative outcomes resulting from the COVID-19 pandemic. Data on average test scores for 50 states and five major school districts was collected from the National Assessment of Educational Progress (NAEP), known as the “nation’s report card.” Using an API, I retrieve data for my variables of interest, namely cohort (4th and 8th grade, subject (mathematics and reading), and year (2019 and 2022).
I collected data on household internet access for the same states and districts from the American Community Survey (5-Year Estimates), retrieved using a Census API key.
Visualizations
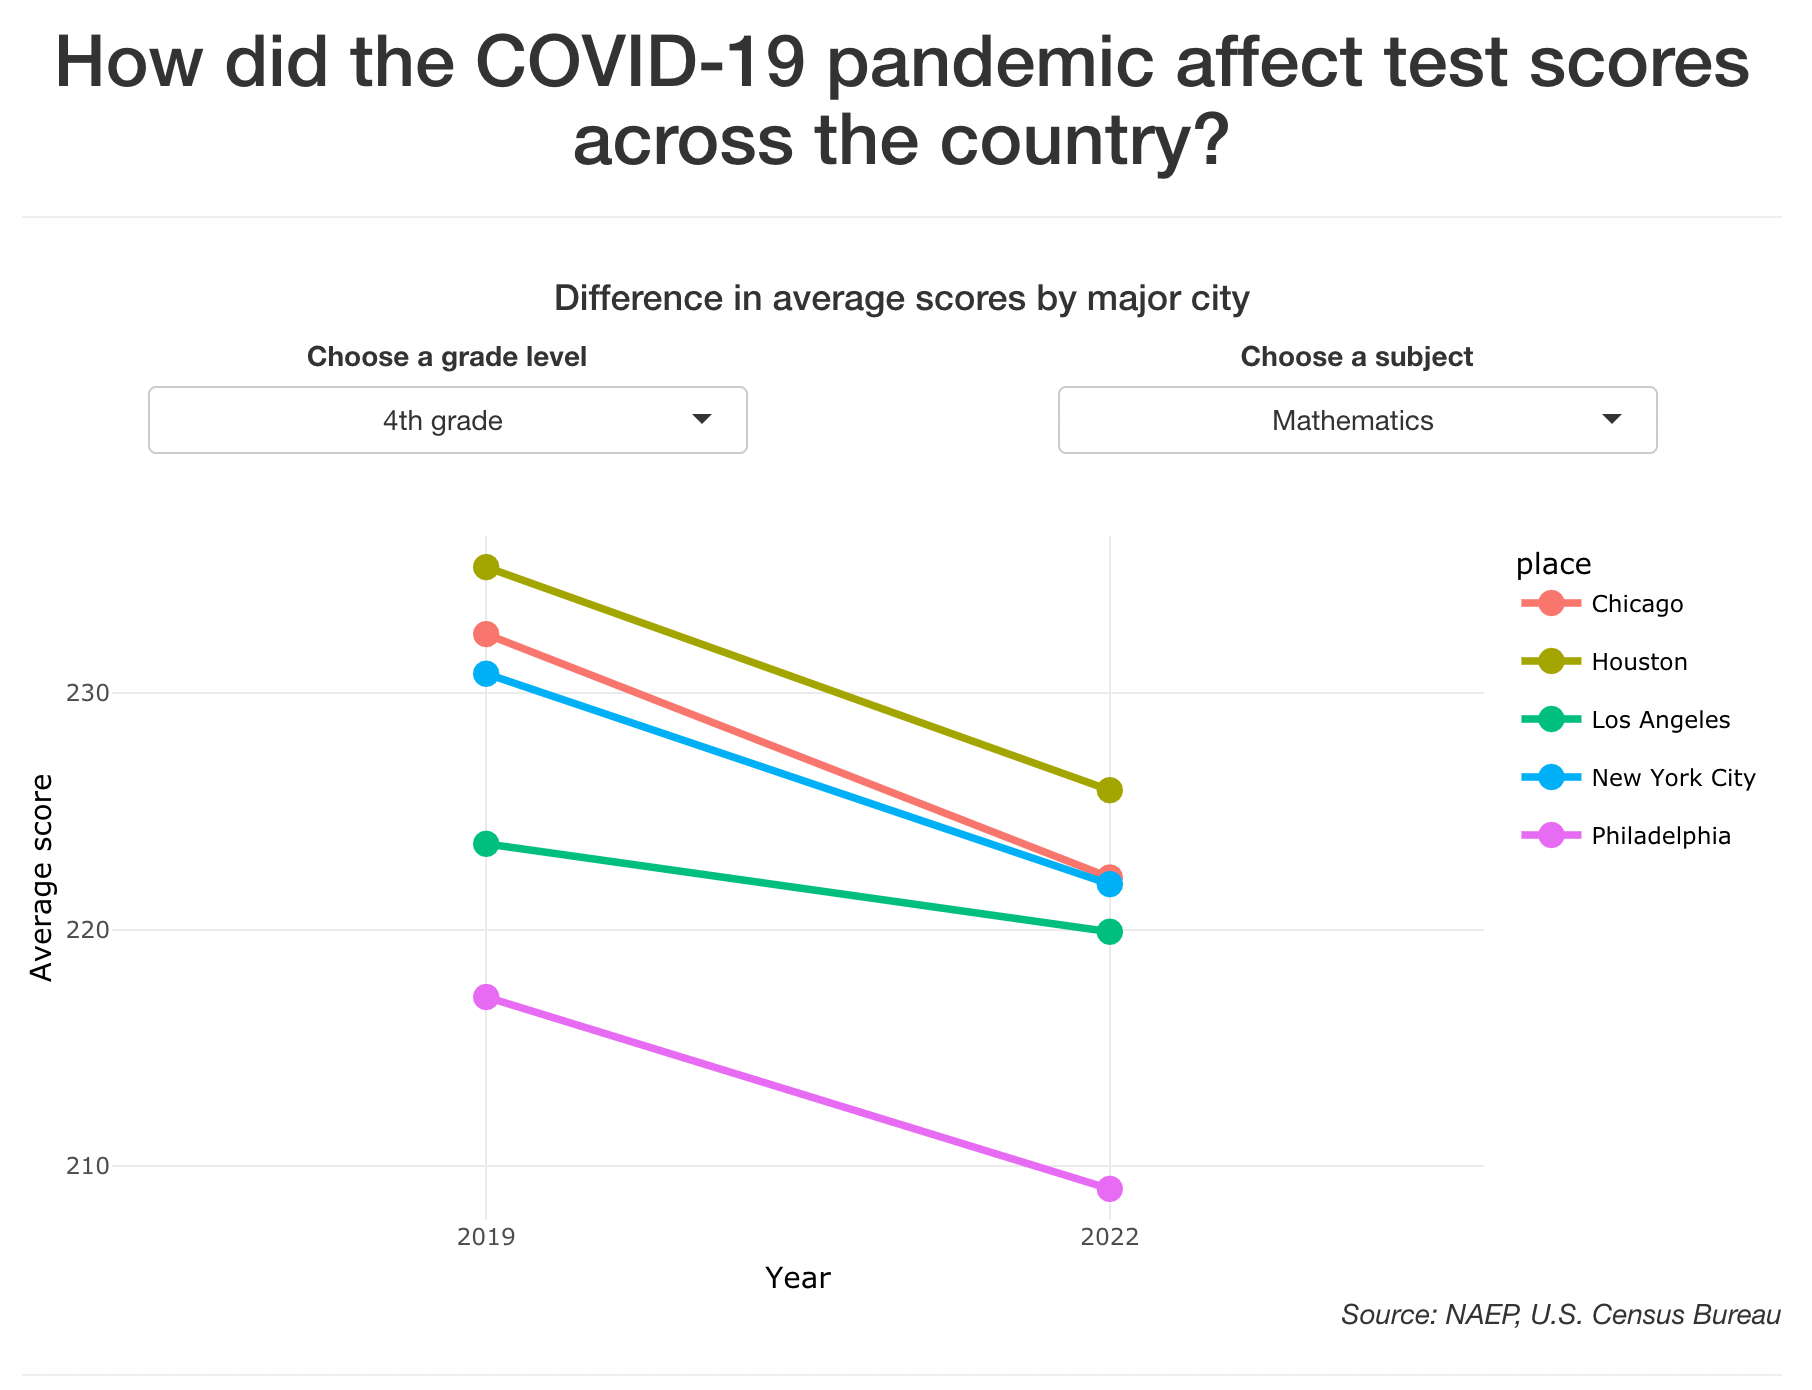
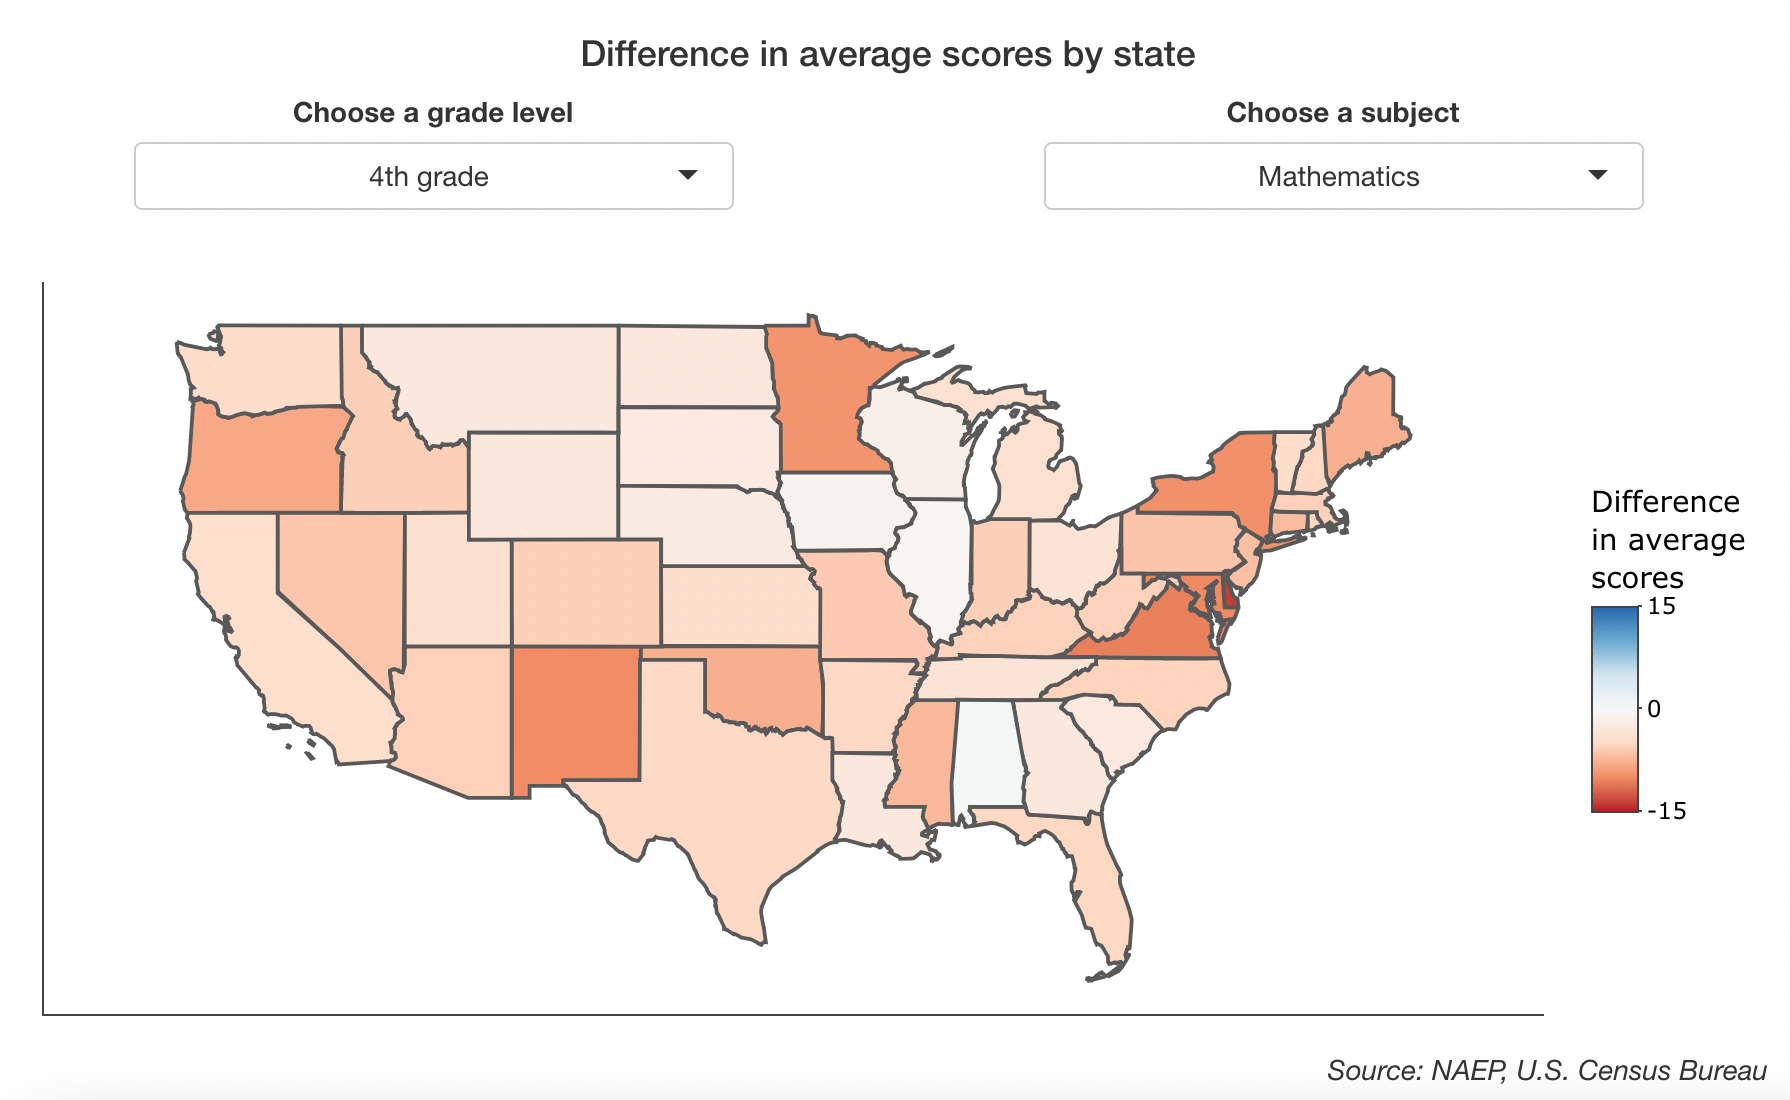
Using the shiny.R tool, I visualize the difference in average scores for city and states between 2019 and 2022. These interactive visualizations can be adjusted by grade level and subject. I find that, while most state average scores decreased, there were a few states whose average scores increased, particularly in reading. Screenshots of the interactive plots are below.
Text Processing
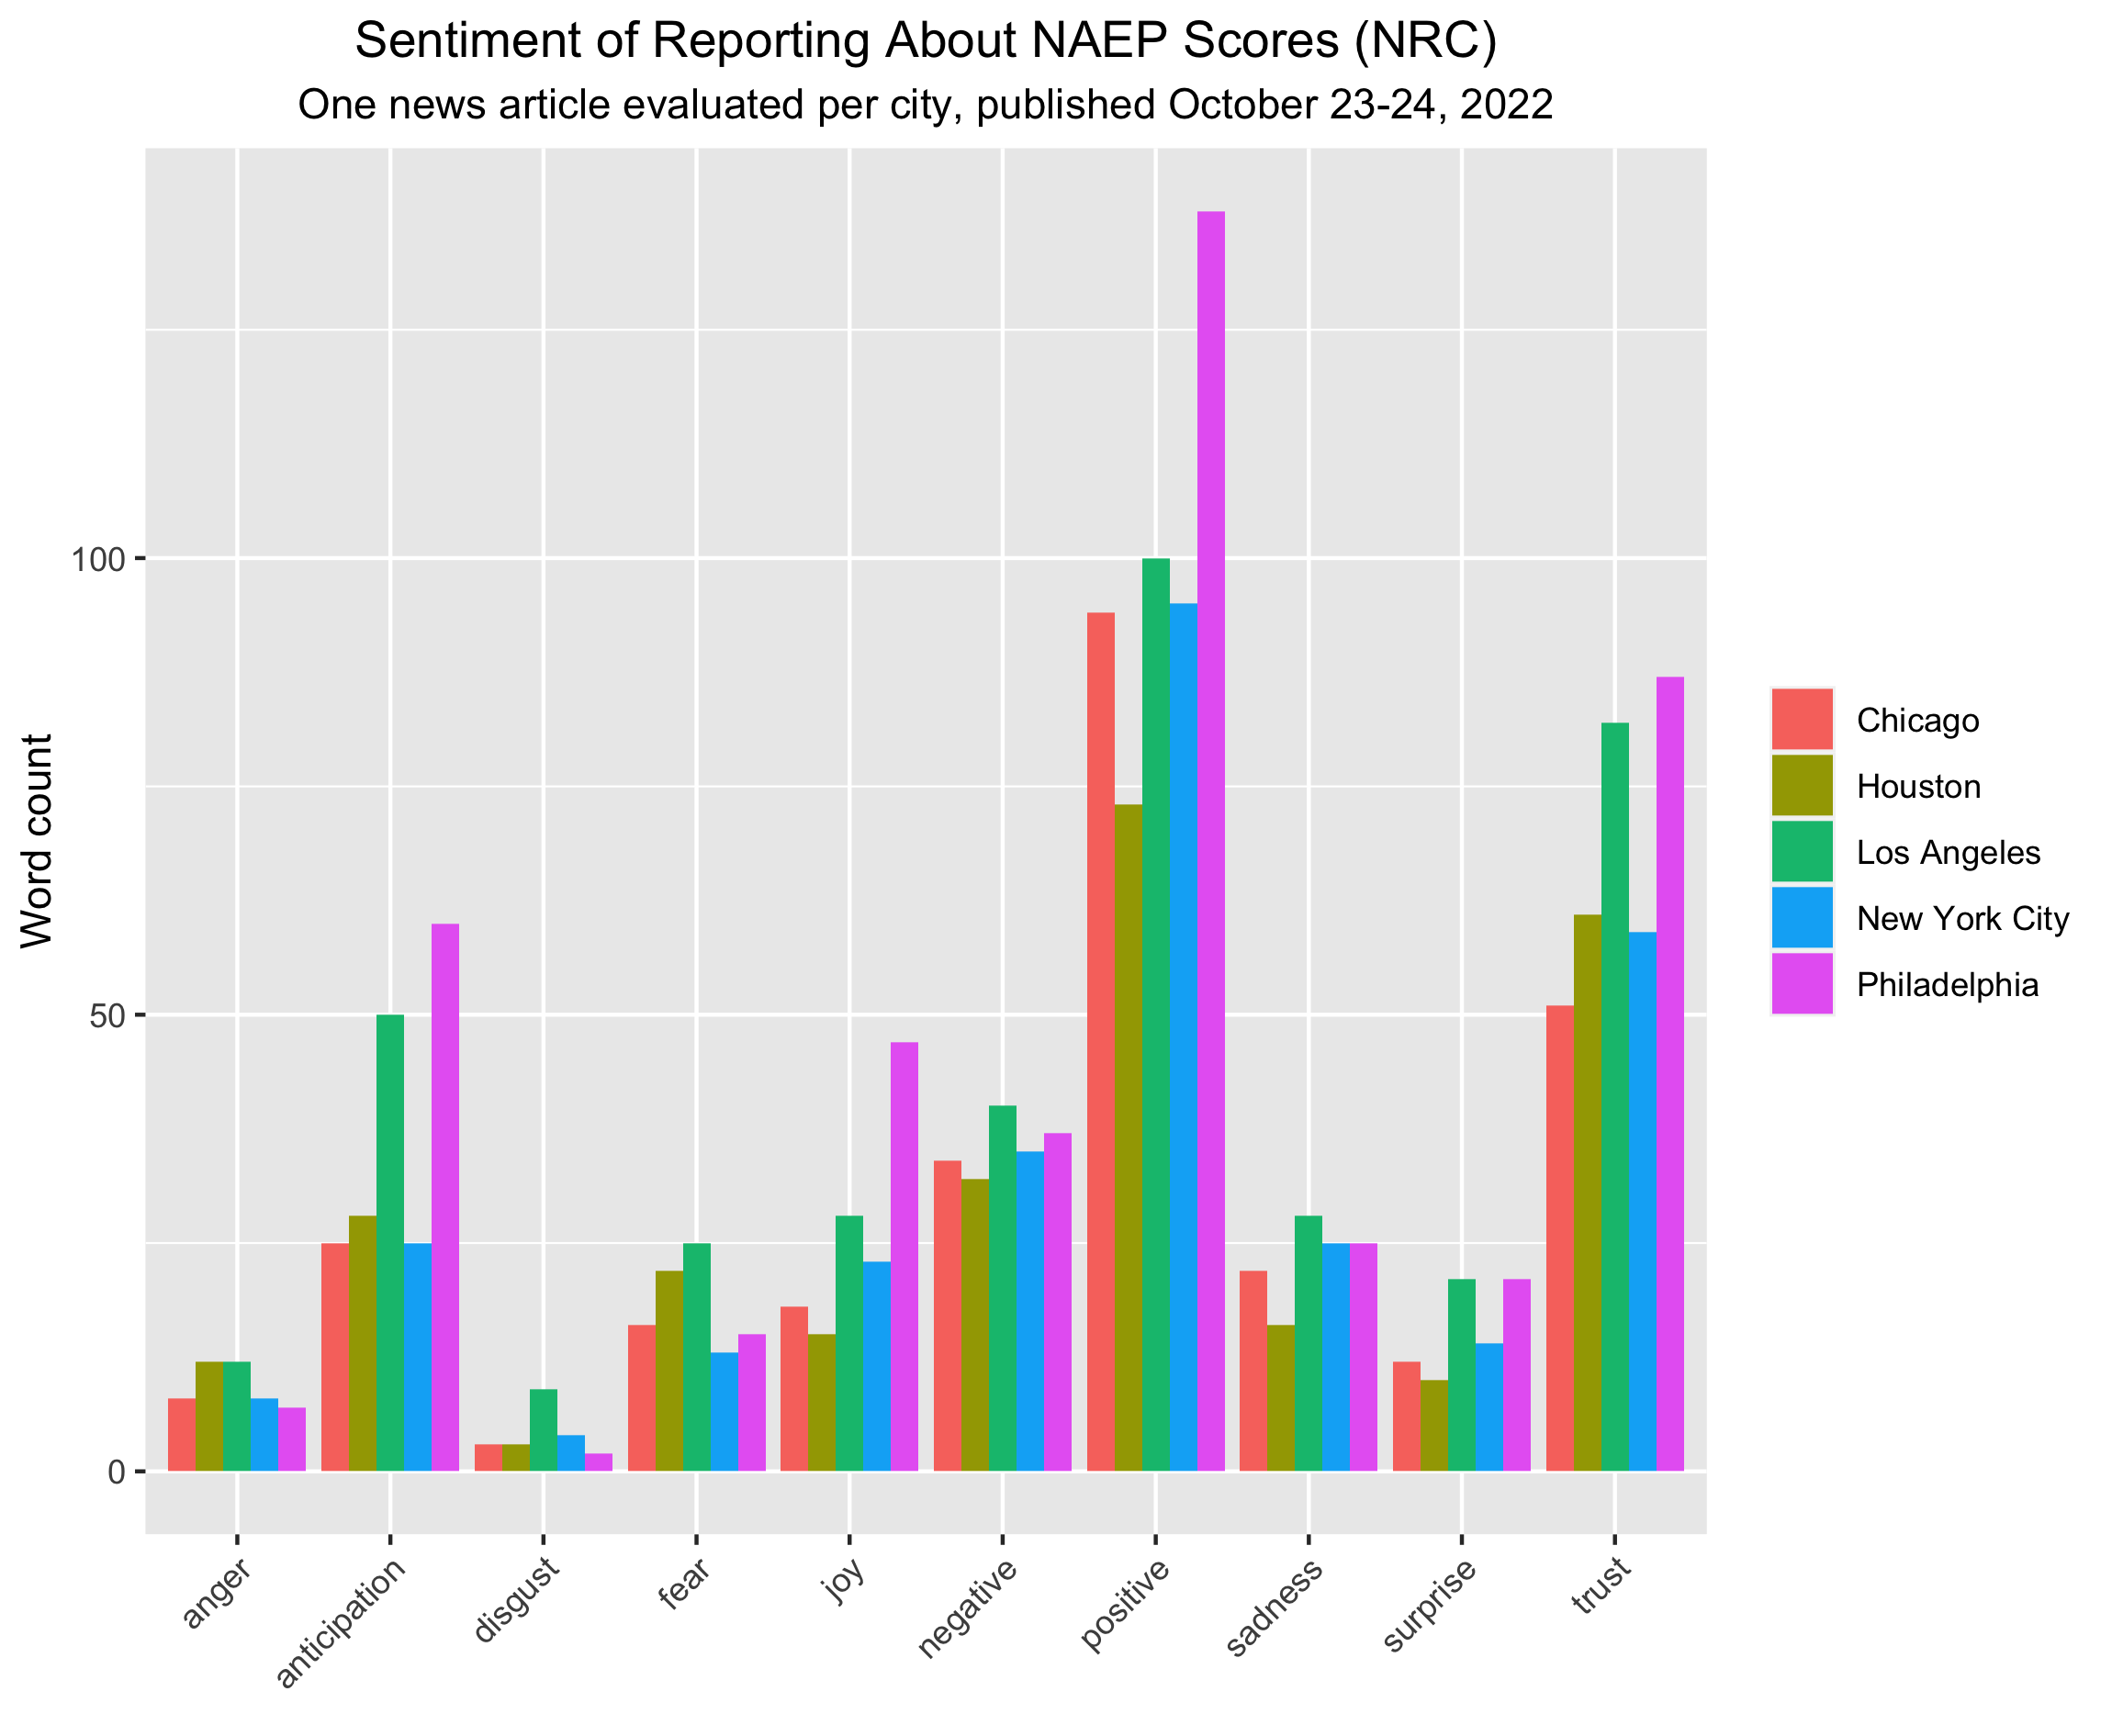
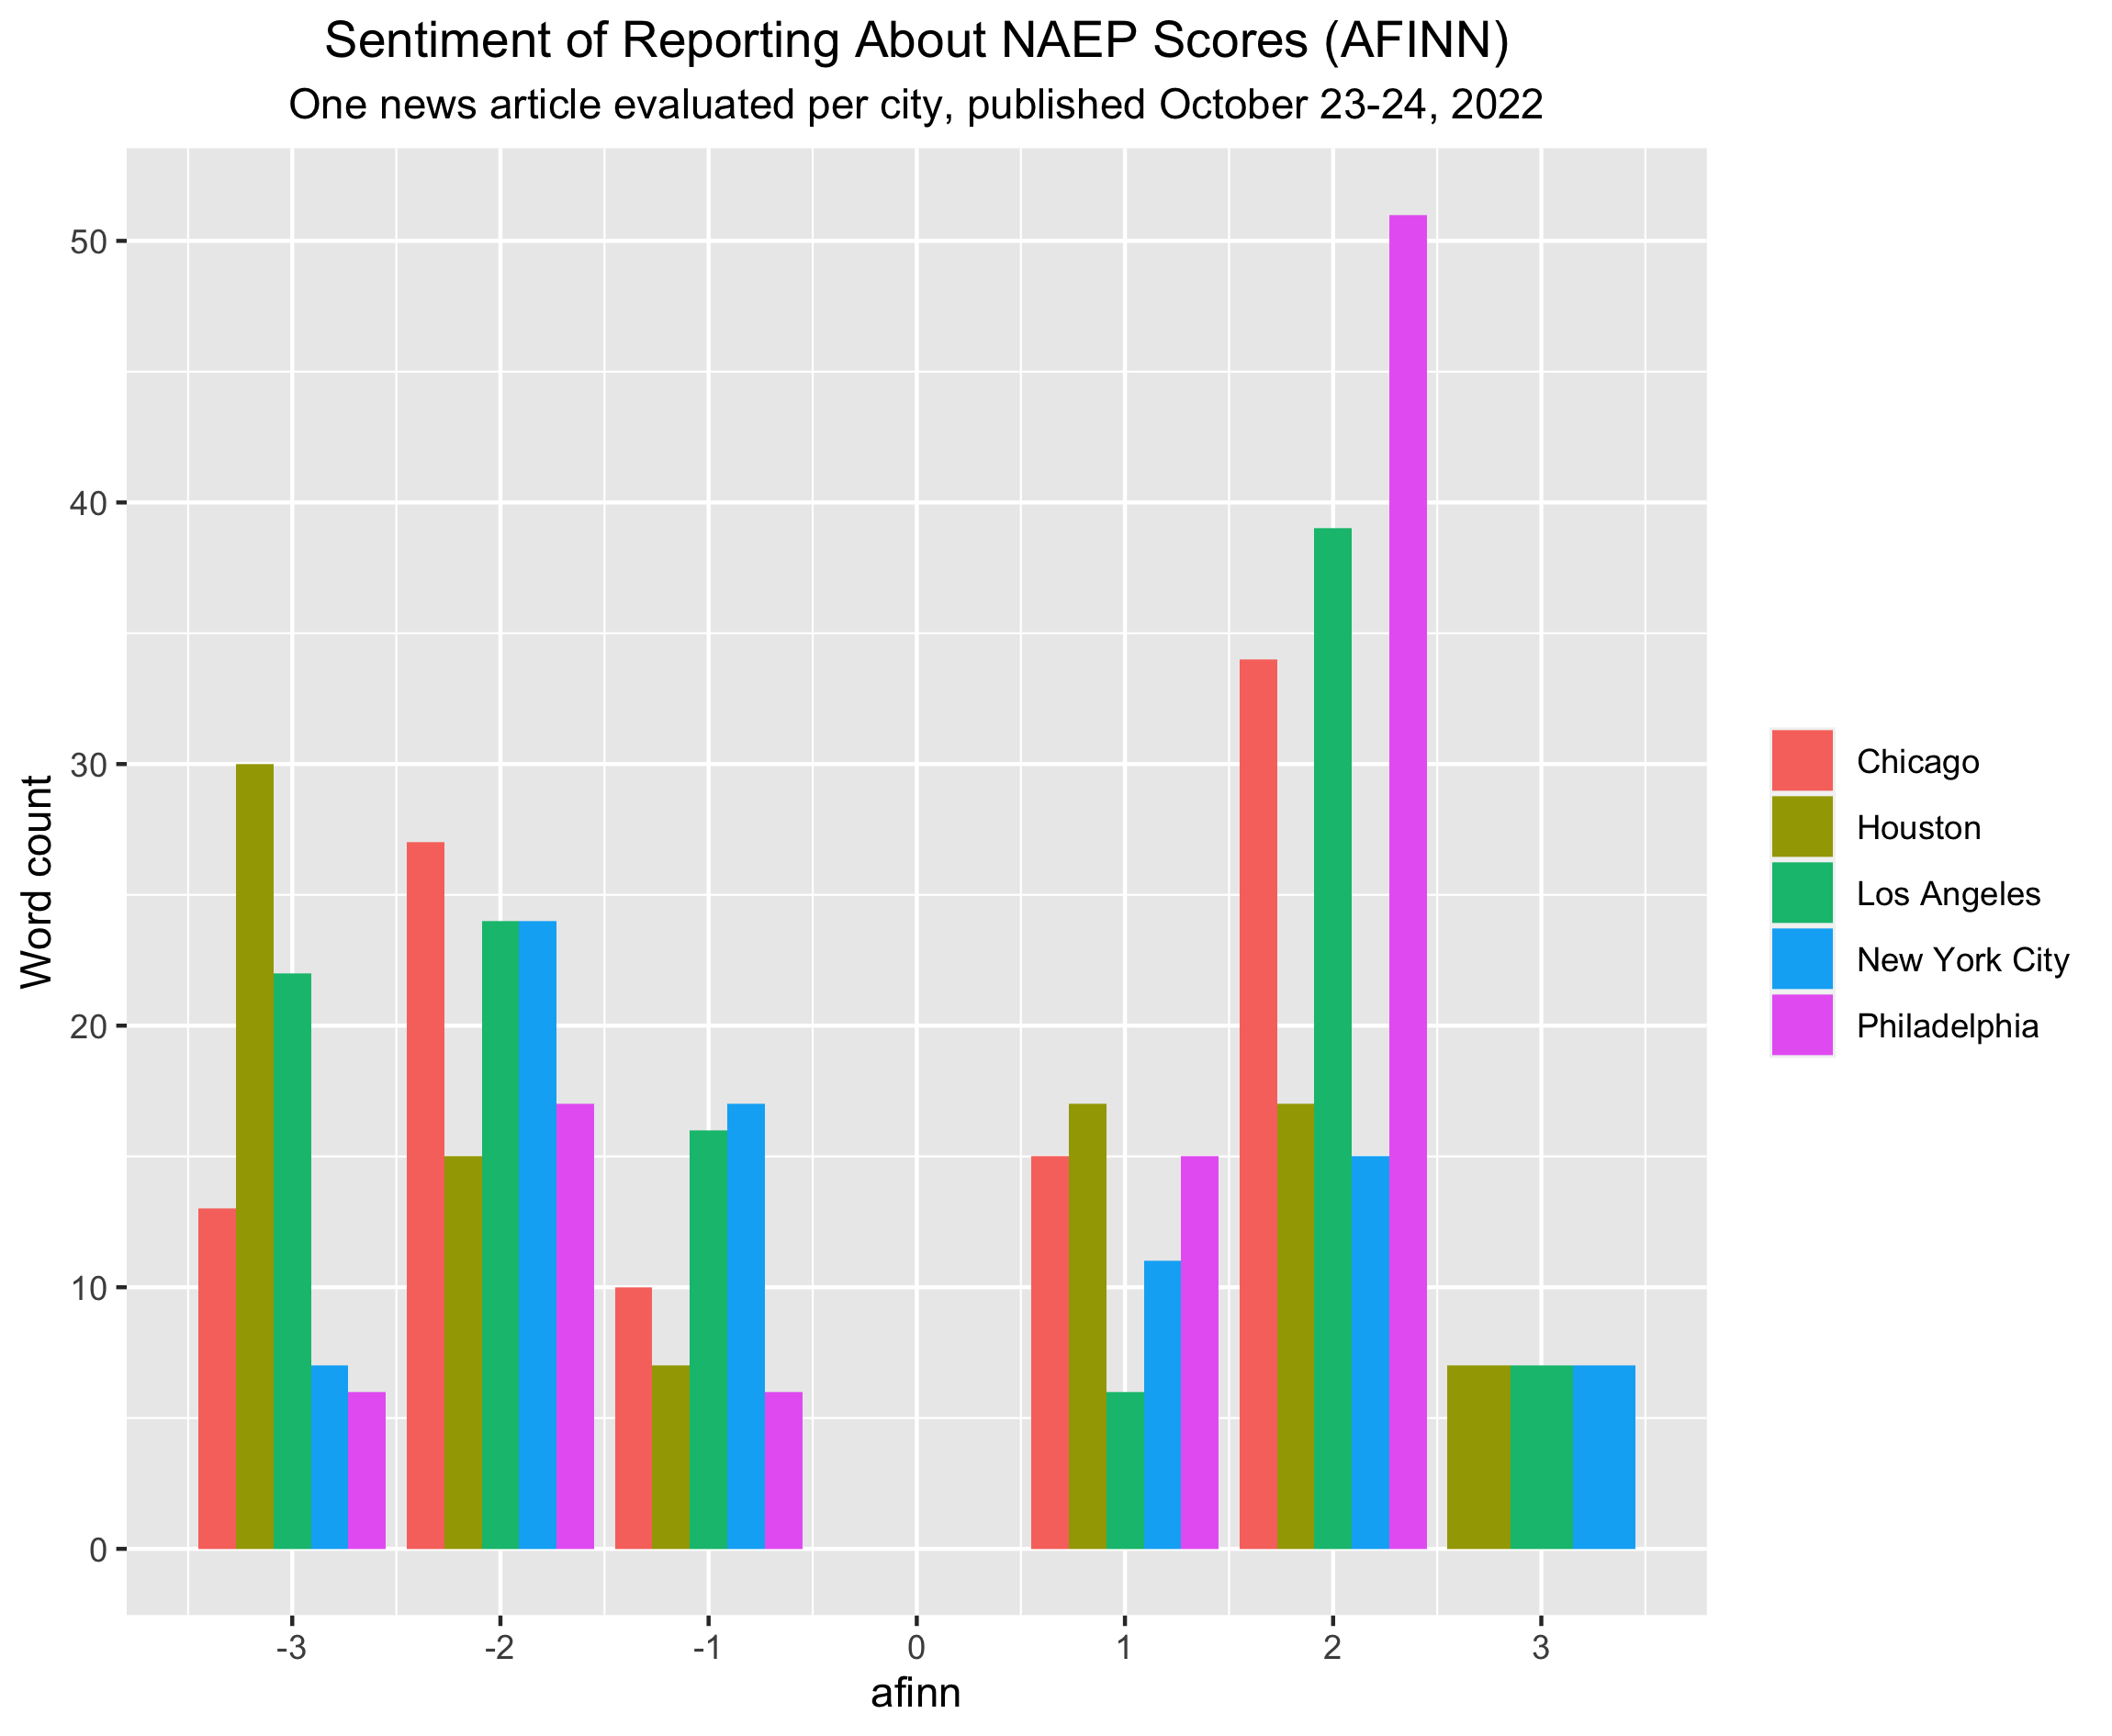
Understanding that some cities faced steeper declines in average scores than others, I wanted to explore whether these negative outcomes were reflected in negative sentiments in the news reporting in that city.
I selected five articles to represent each of the major cities. Each article was published on October 23-24, 2022, a day or so after the 2022 NAEP scores were available to the public. Each article was published on a local news site. I used web-scraping tools to parse each article, separated the parsed html text into tokens, then used the tokens to analyze the sentiments of each article. I compared sentiments between cities using NRC and AFINN sentiments, visualized in the plots below:
Modeling
To more clearly understand the extent of any relationship between average test scores and internet access, I used linear regression to predict average test score based on the share of households with internet access. I controlled for year, grade, subject, and type of place (i.e. city or state).
I find that there is a significant, albeit small, relationship between internet access and average test scores. Namely, that a one percentage point increase in the share of households (with school age children) with internet access results in a 1.02-point increase in average test score. This result is significant, with a p-value of < 0.001. This result is visualized in my first static plot.
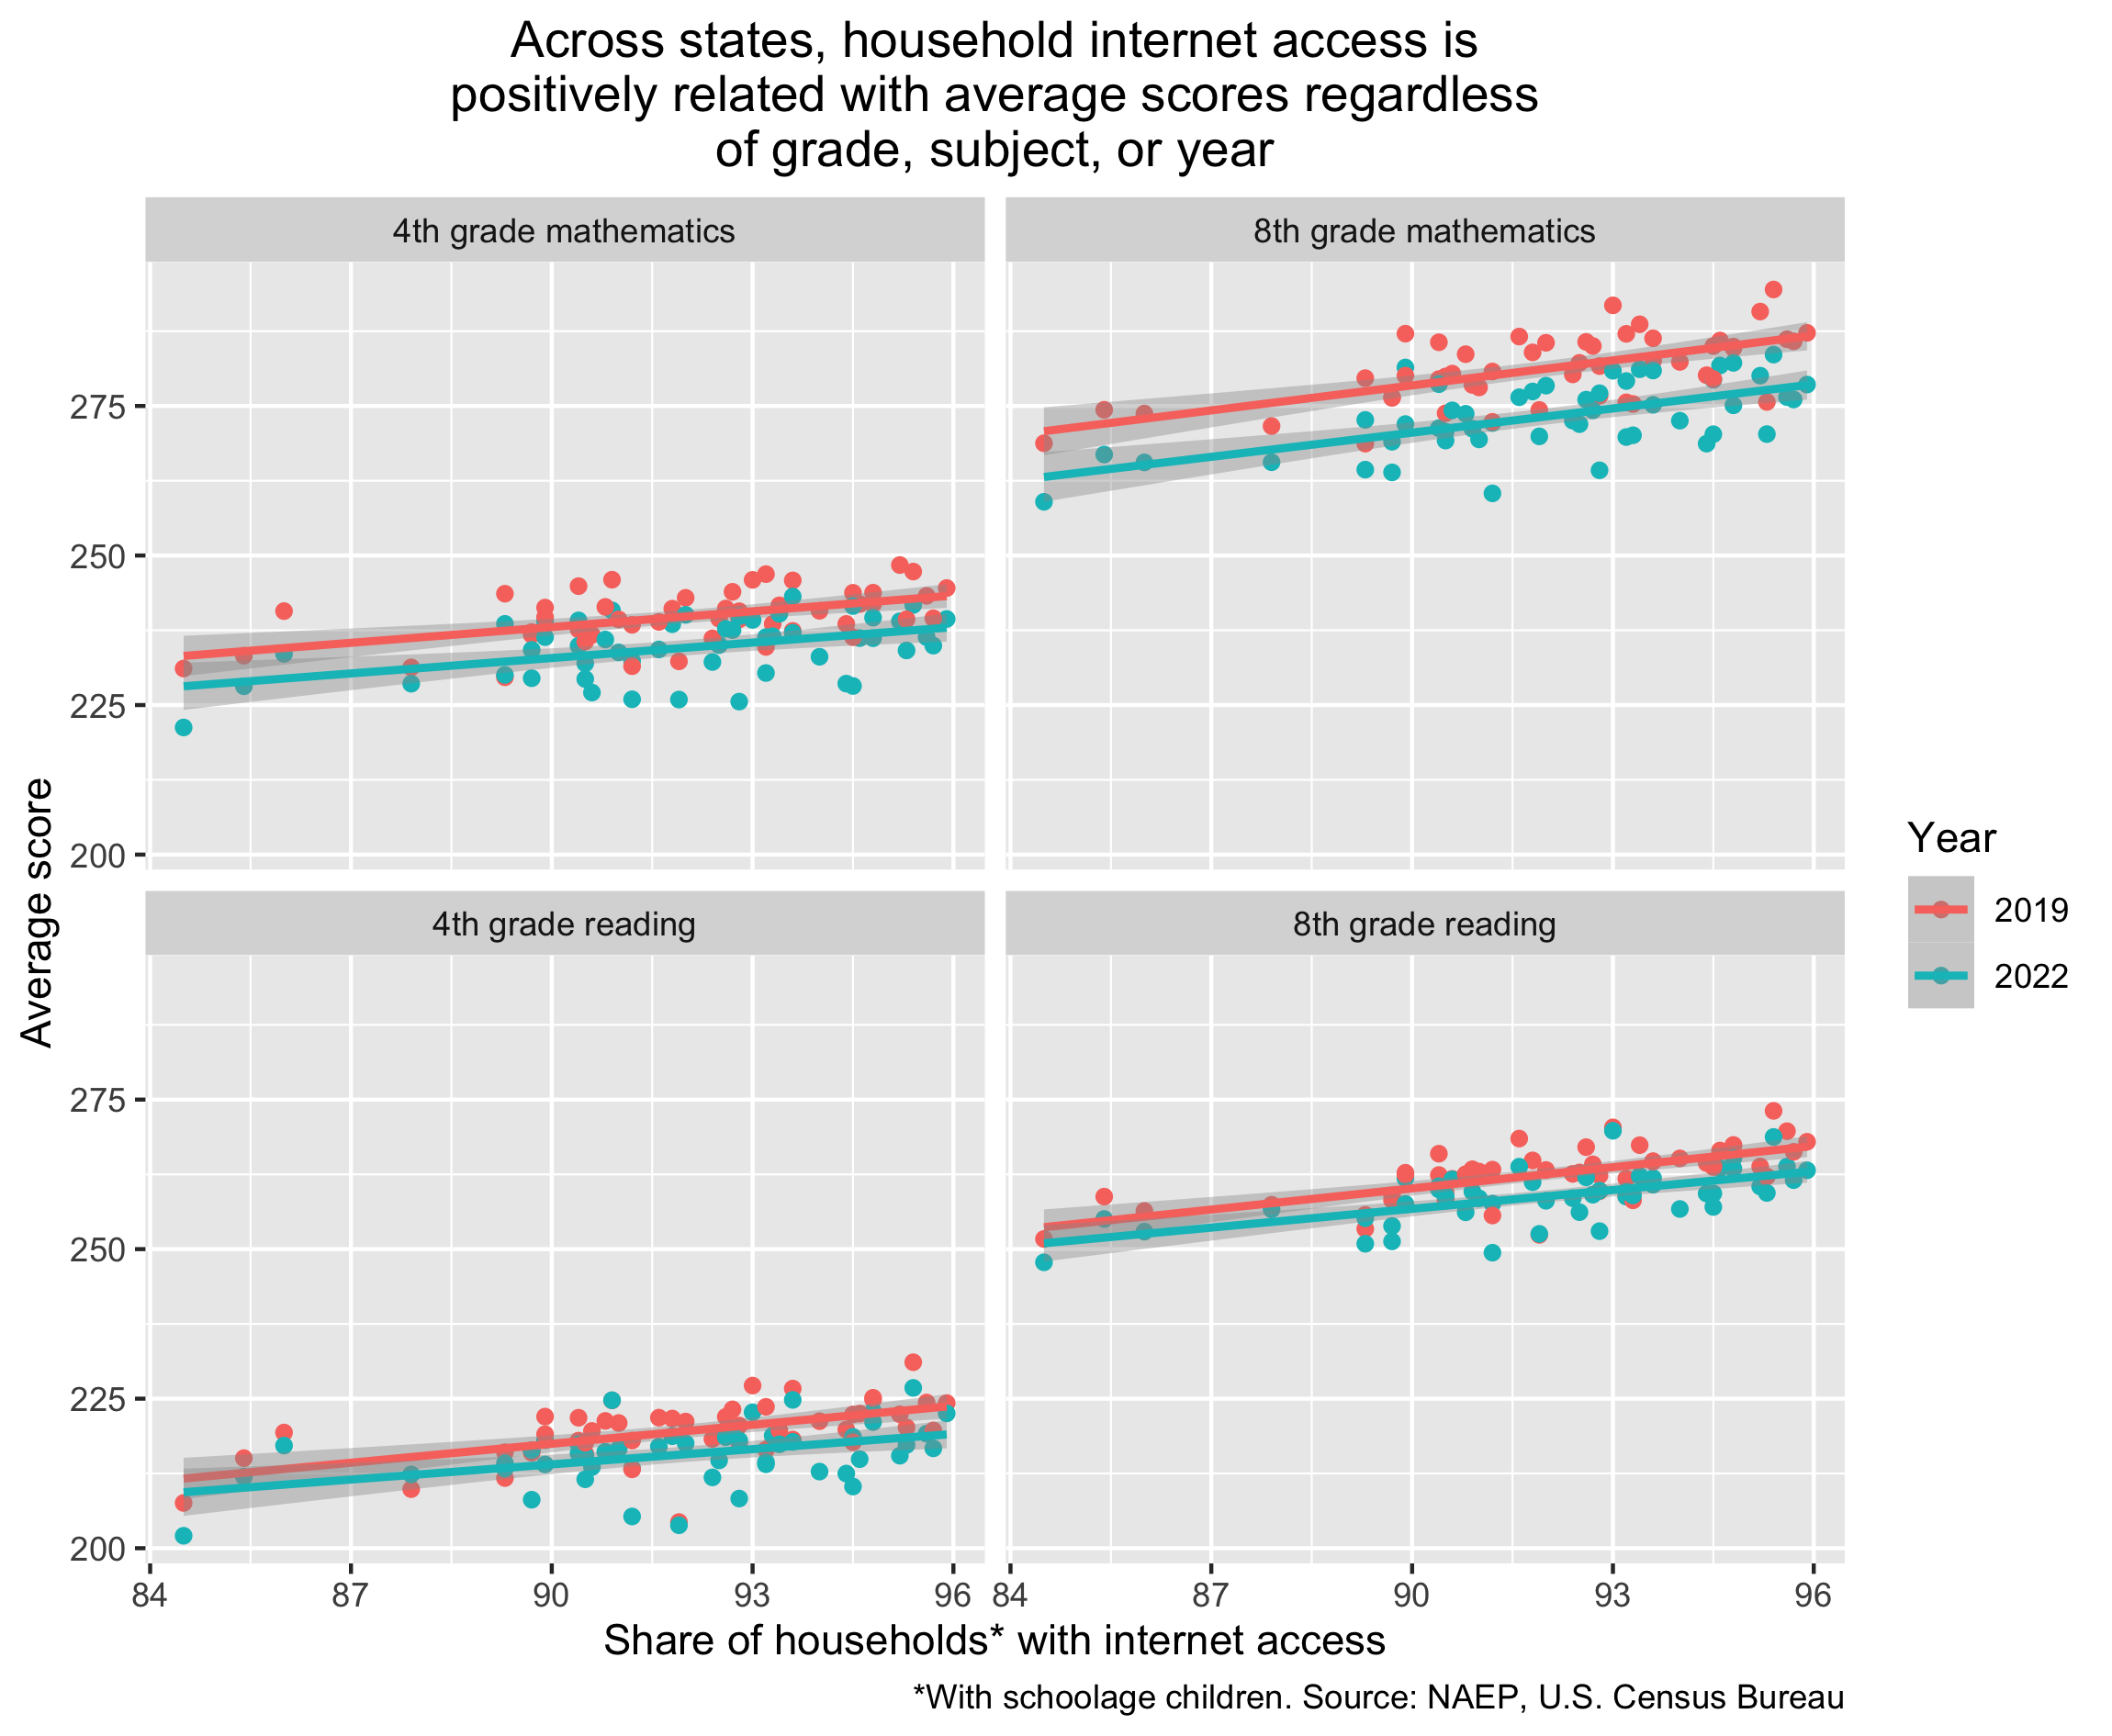
I also find that a shift in year from 2019 to 2022 results in a 5.02 decrease in score, on average, and that average scores reported for states are, on average, 8.89 points higher than average scores reported for cities.
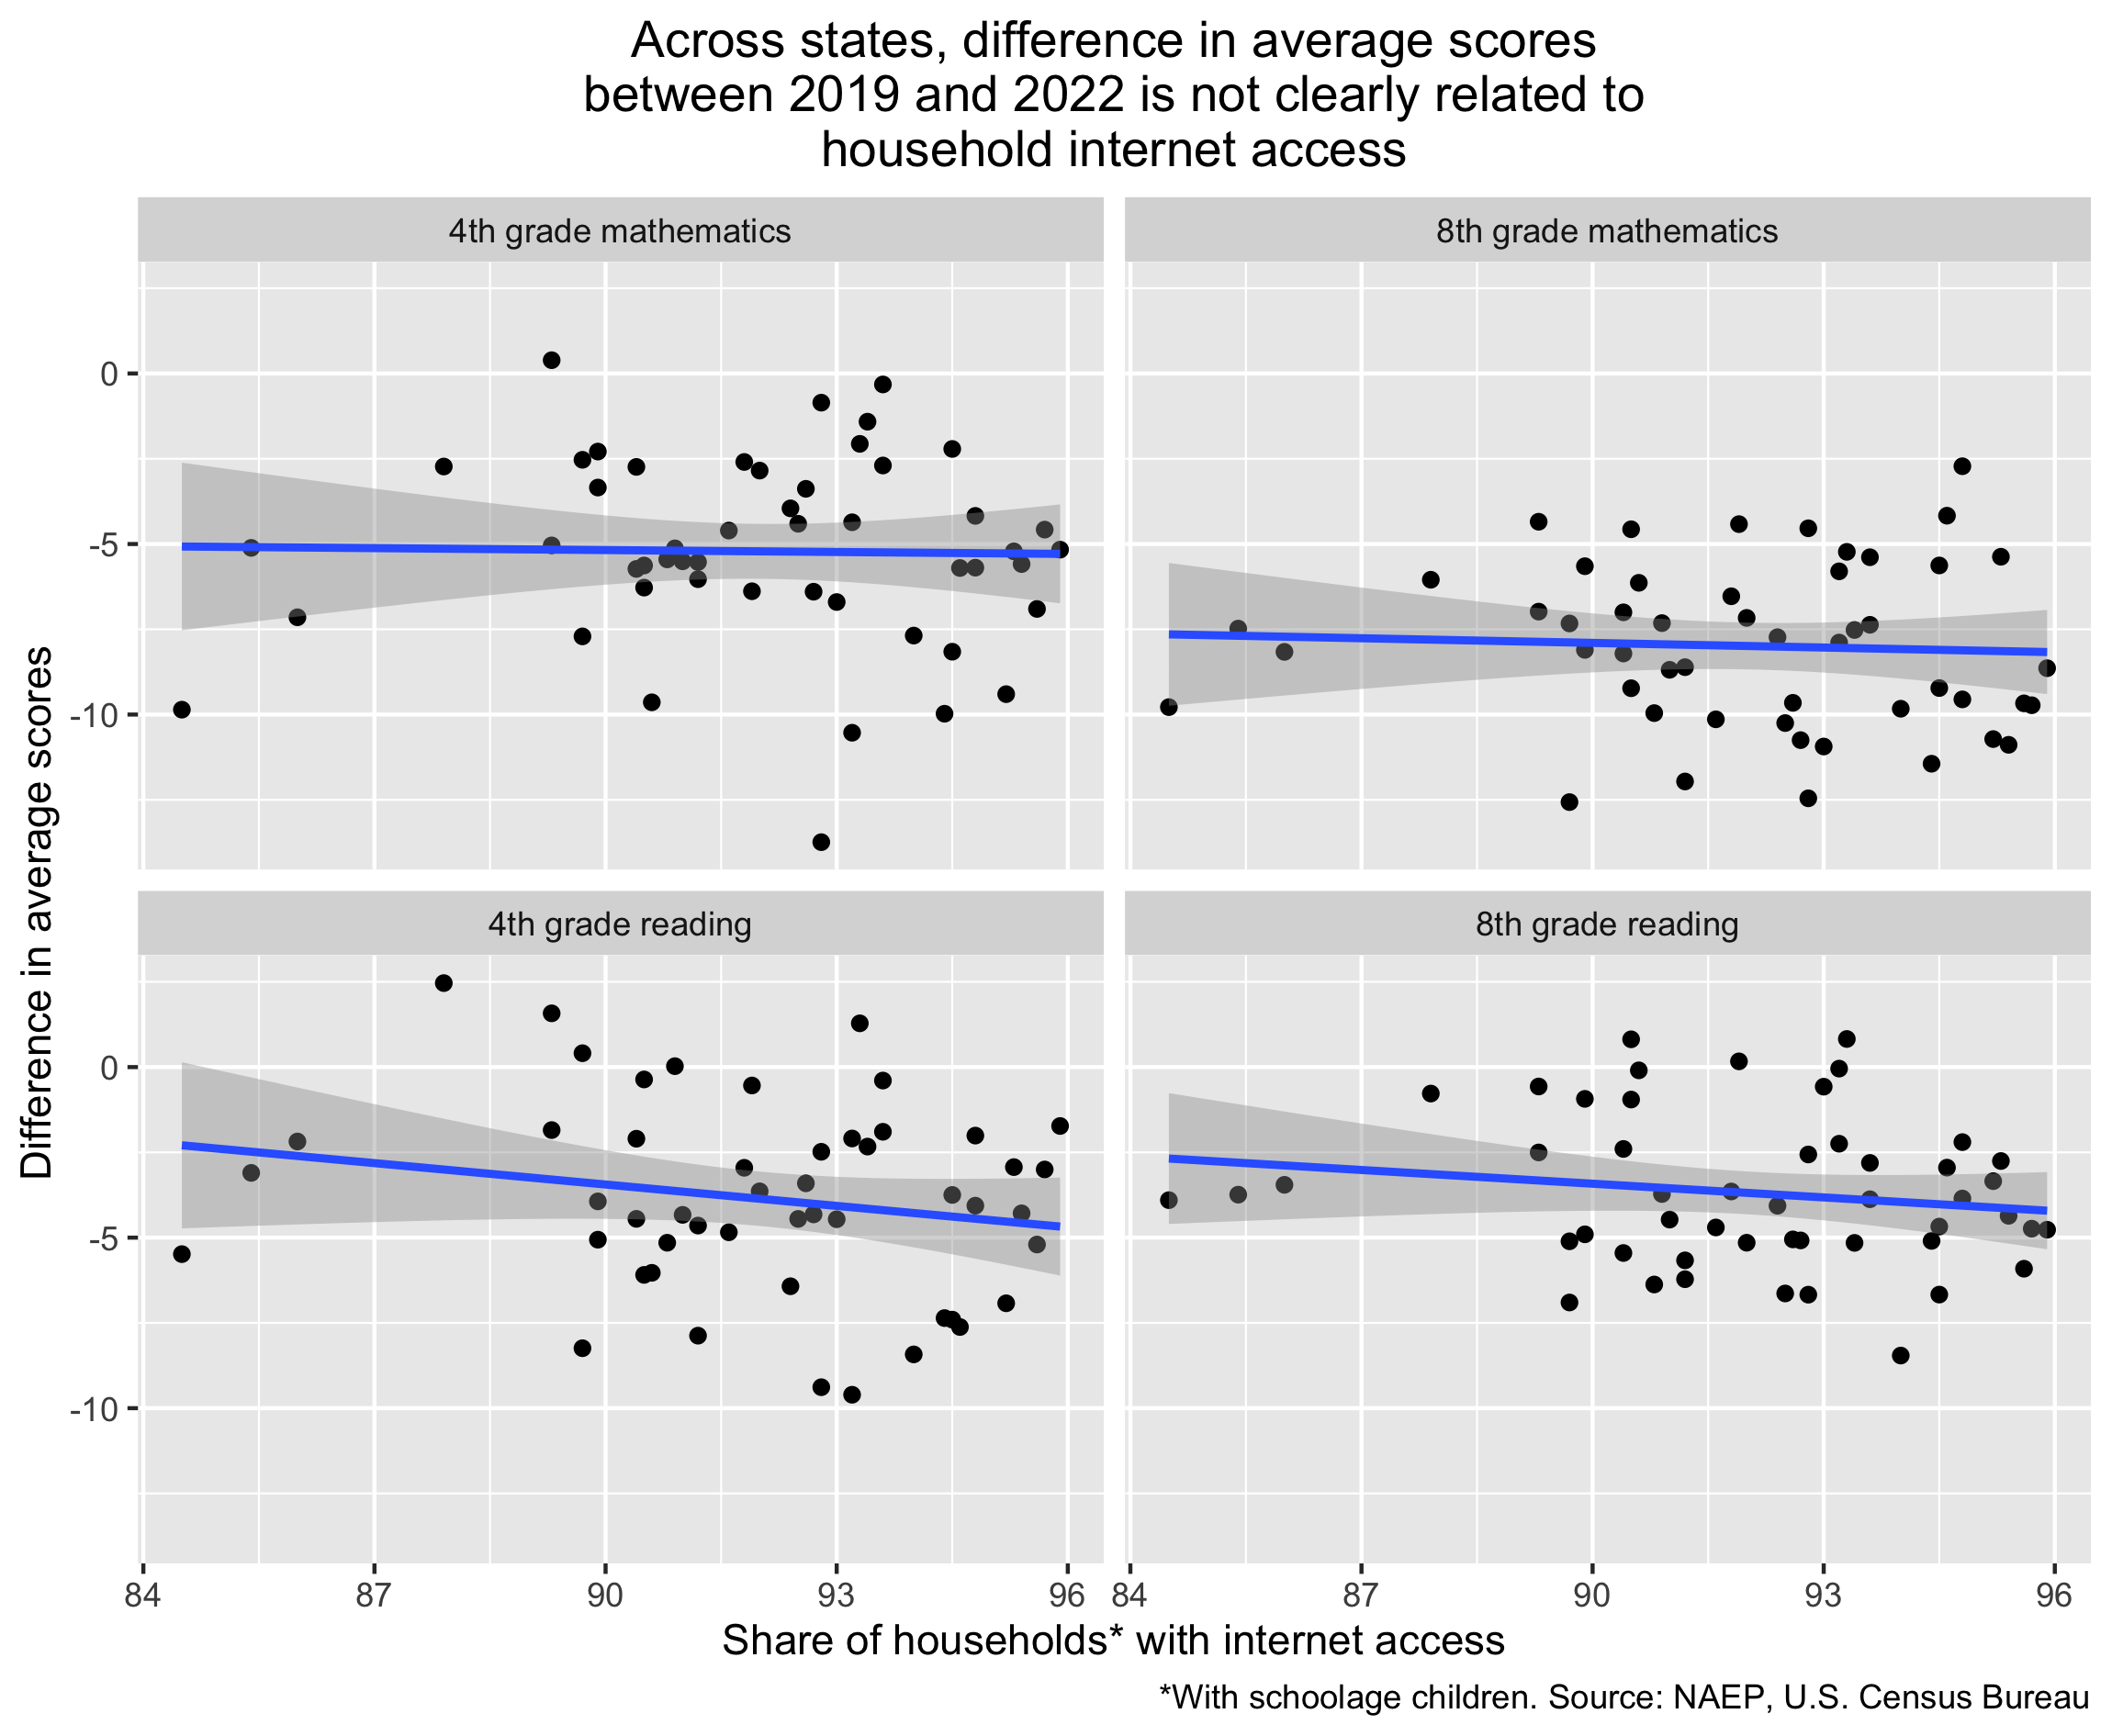
Finally, I find that a one-percentage point increase in the share of households (with school age children) with internet access results in -0.07 difference in scores between 2019 and 2020. This result, however, was not reported as significant. This finding makes sense, given that the results visualized in my second static plot were also unclear.
The project was completed in R. View project files on GitHub.
