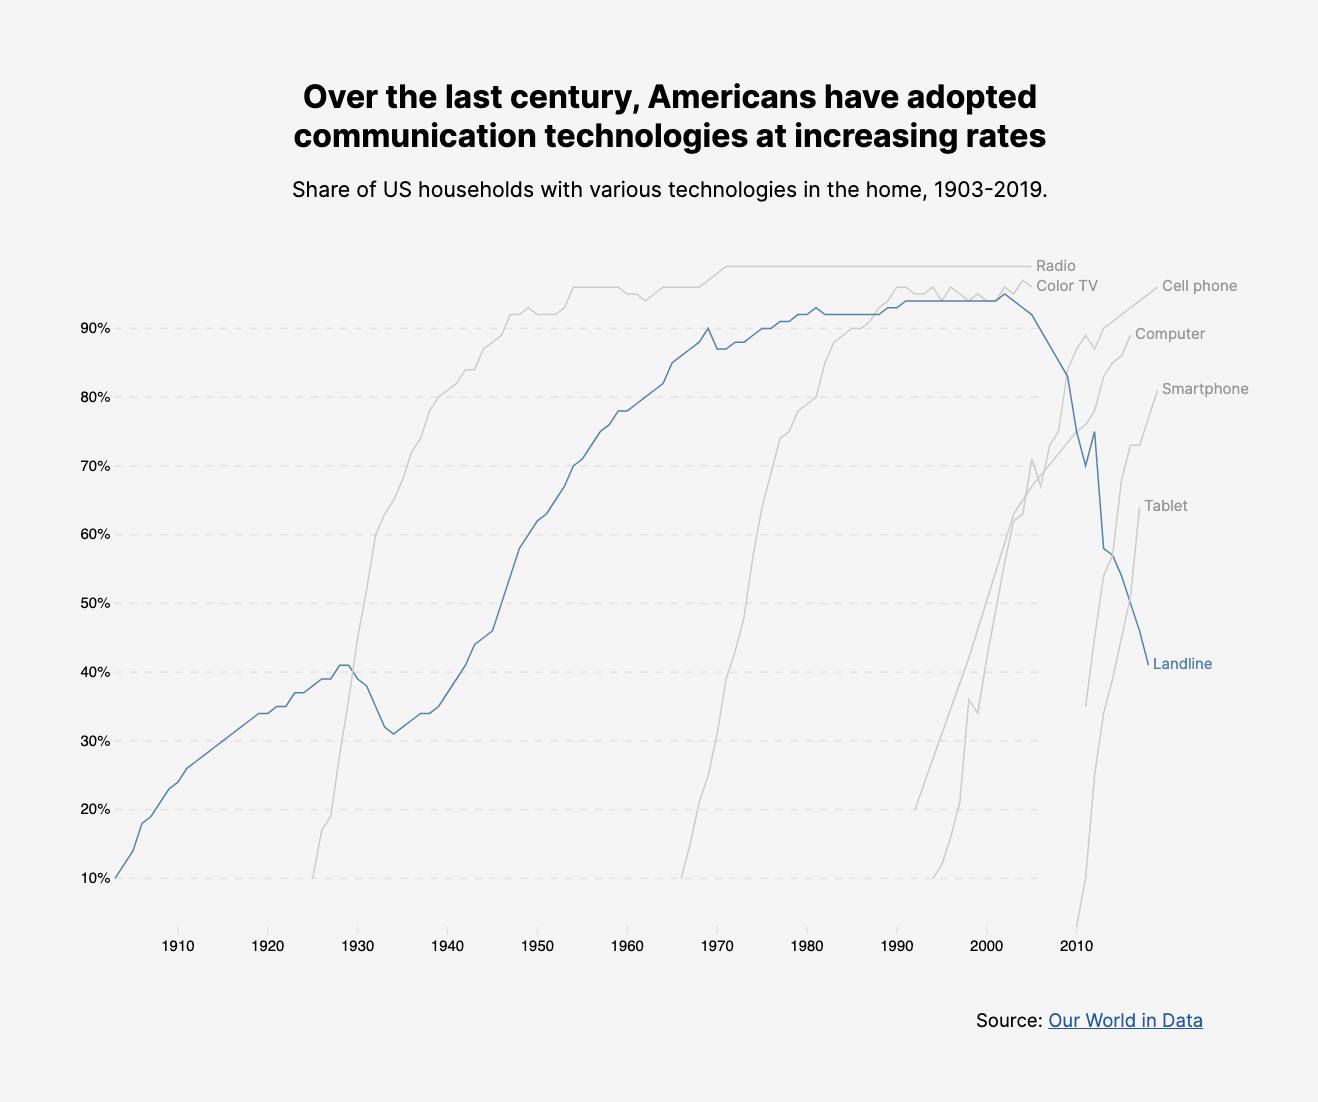
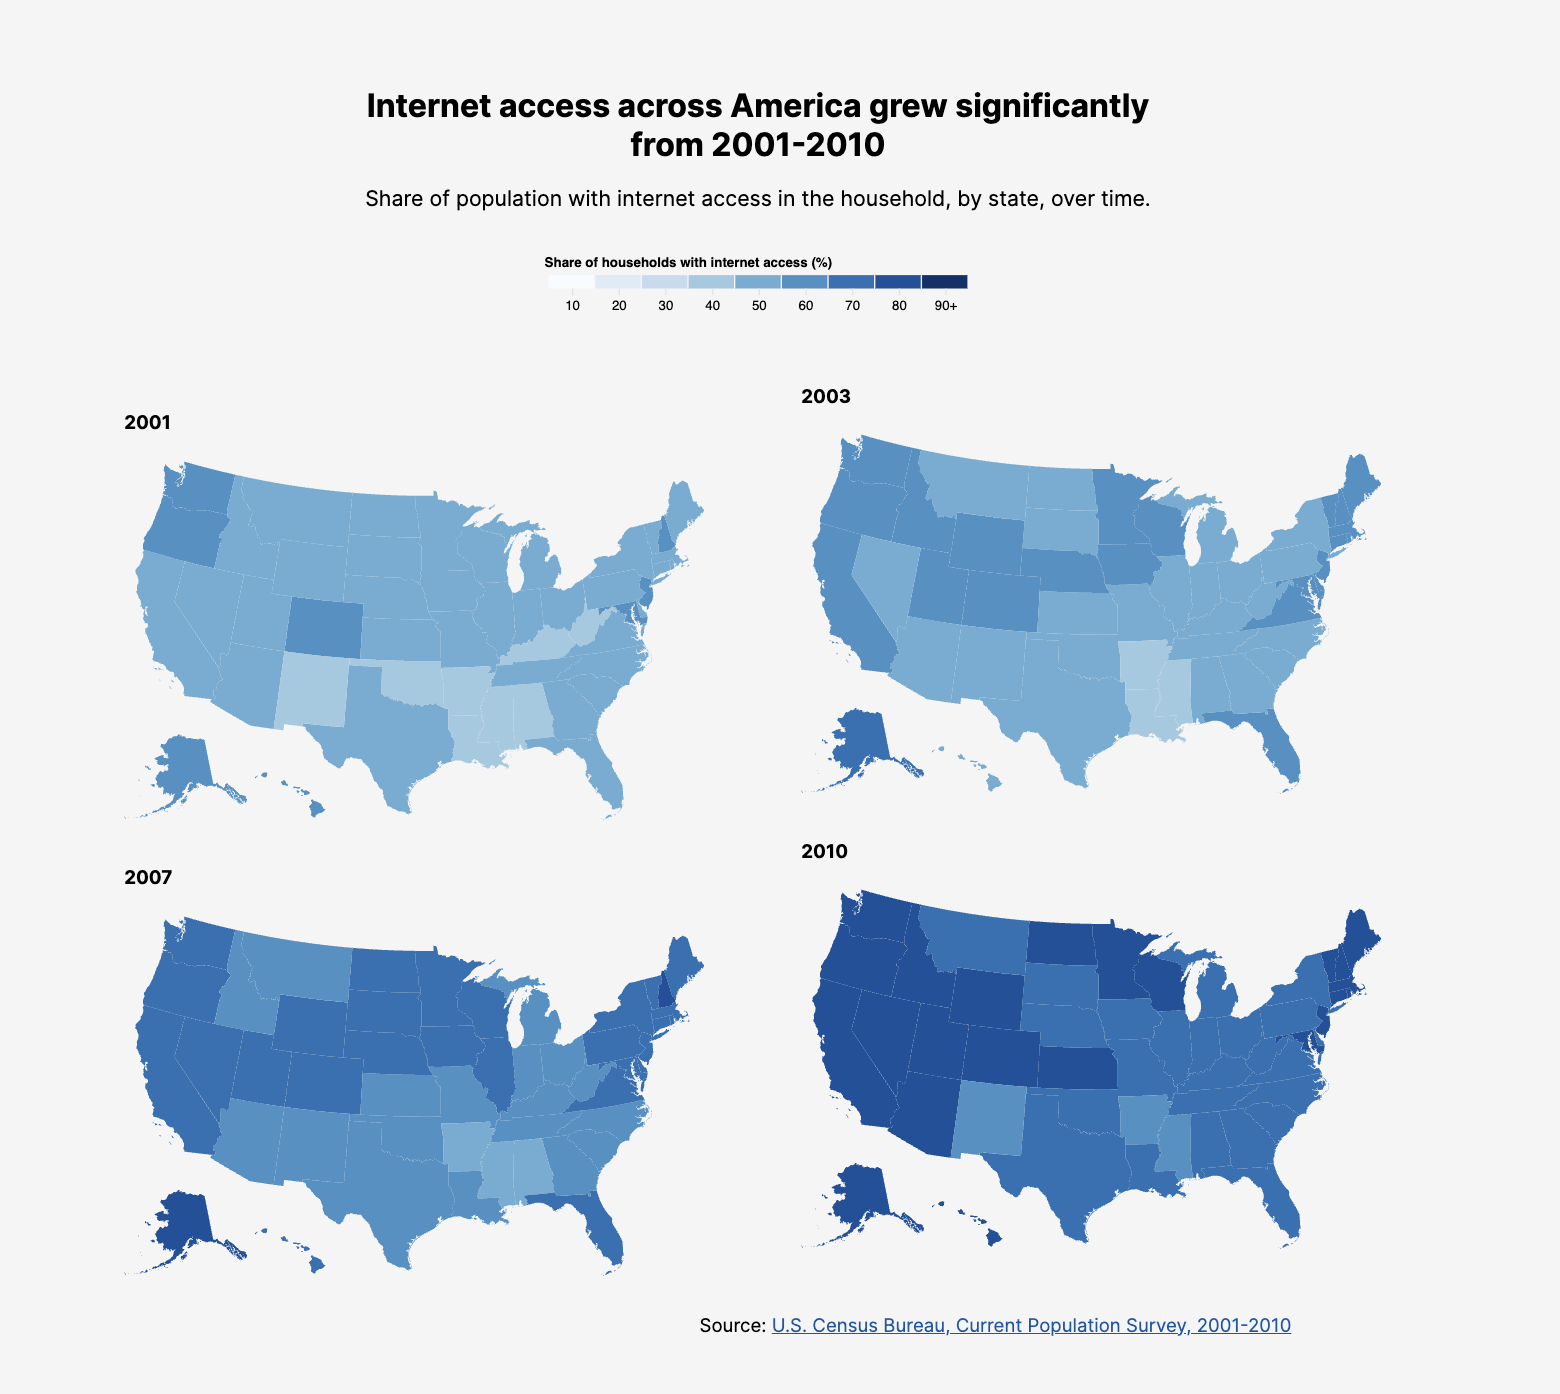
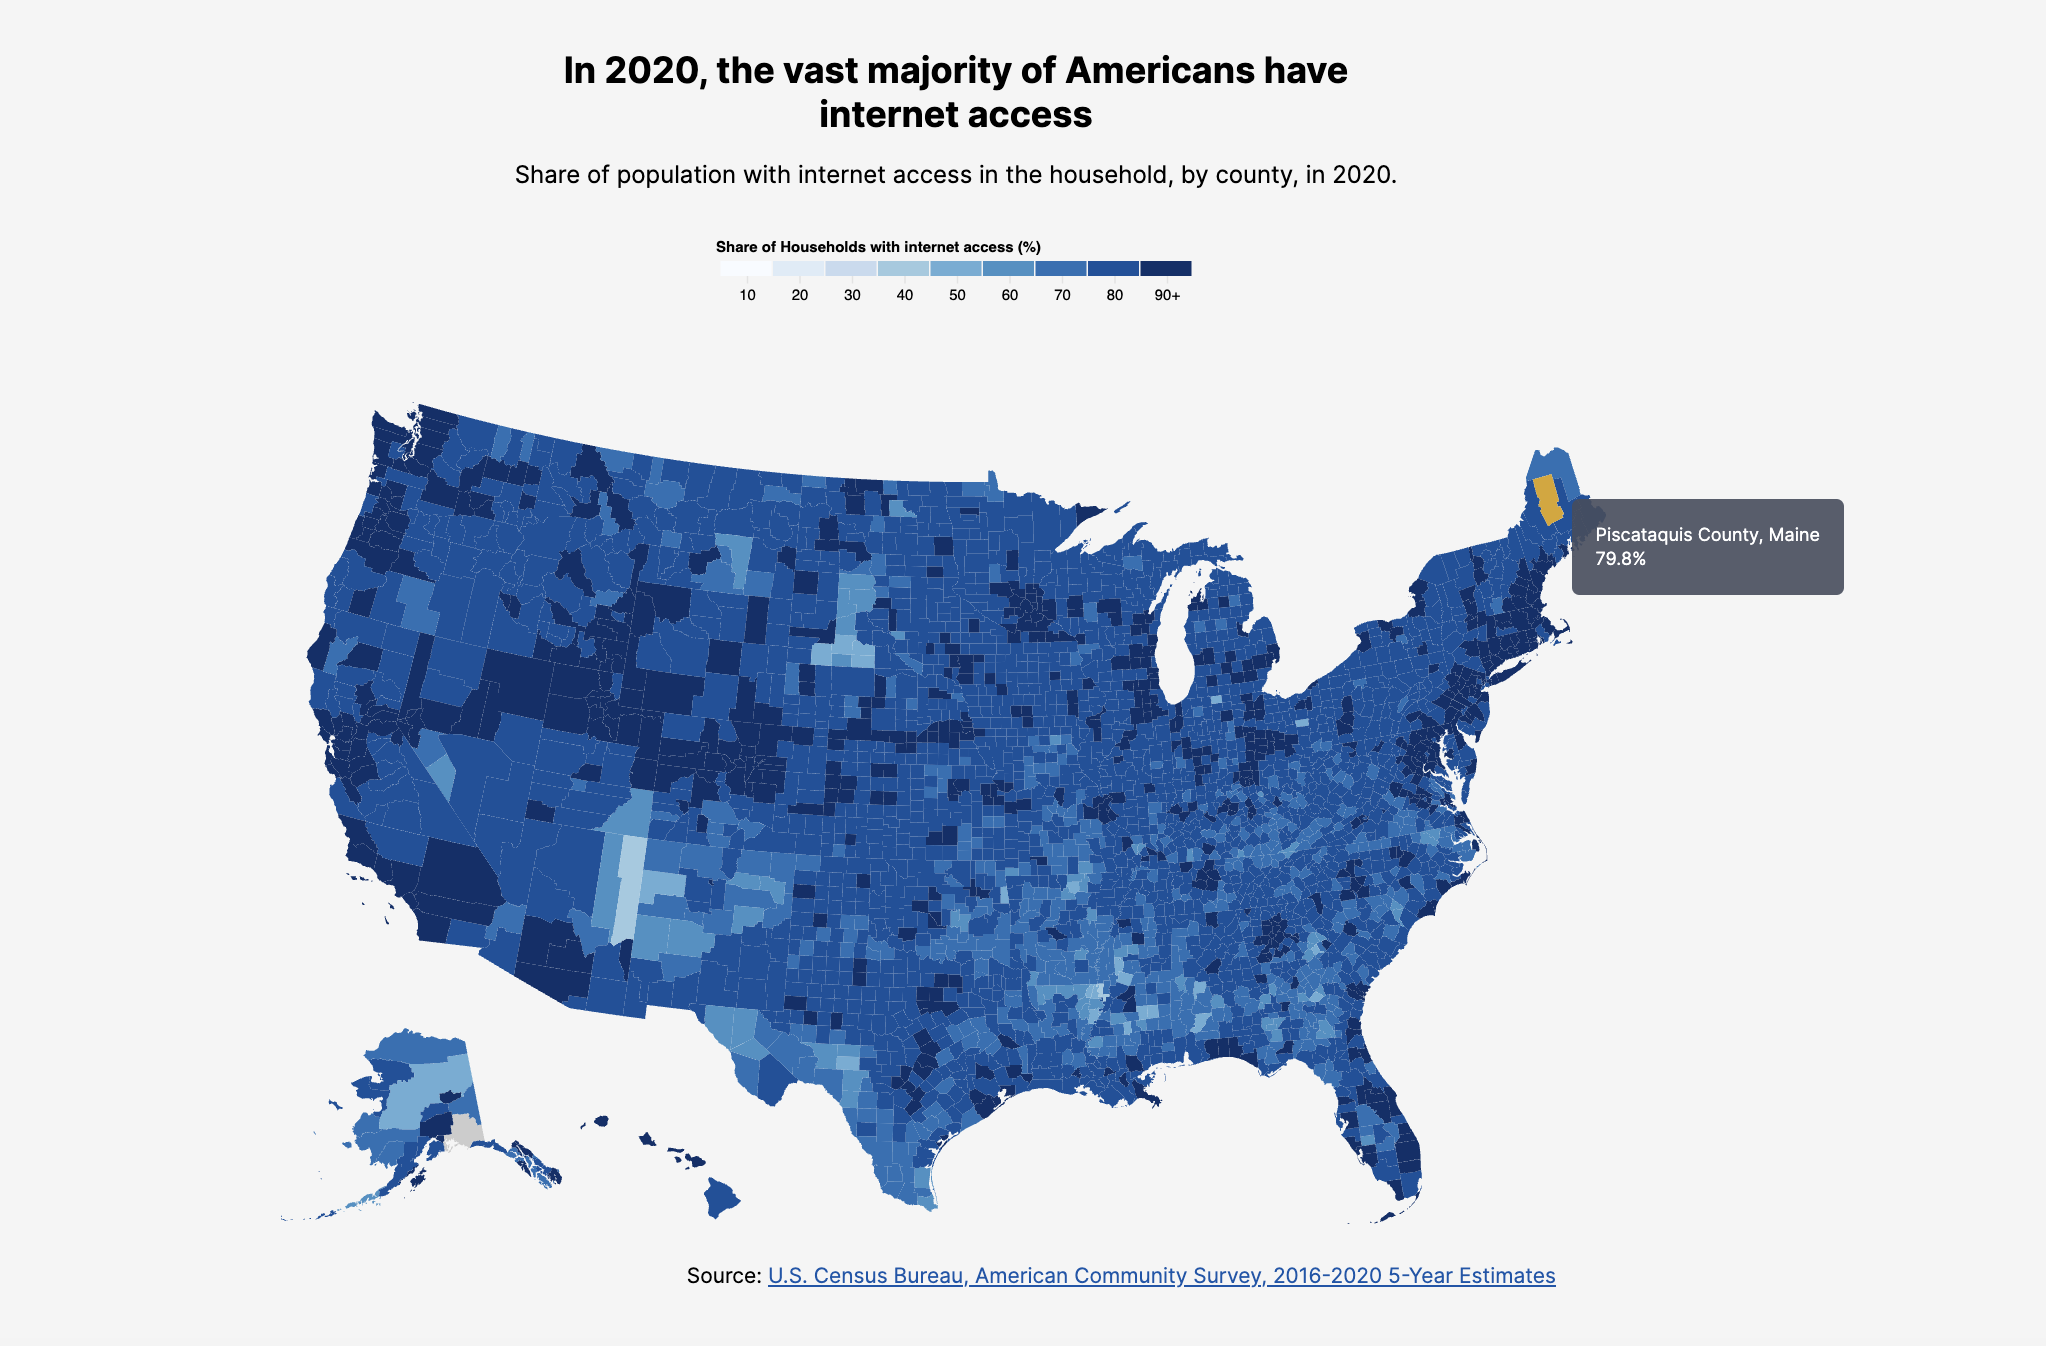
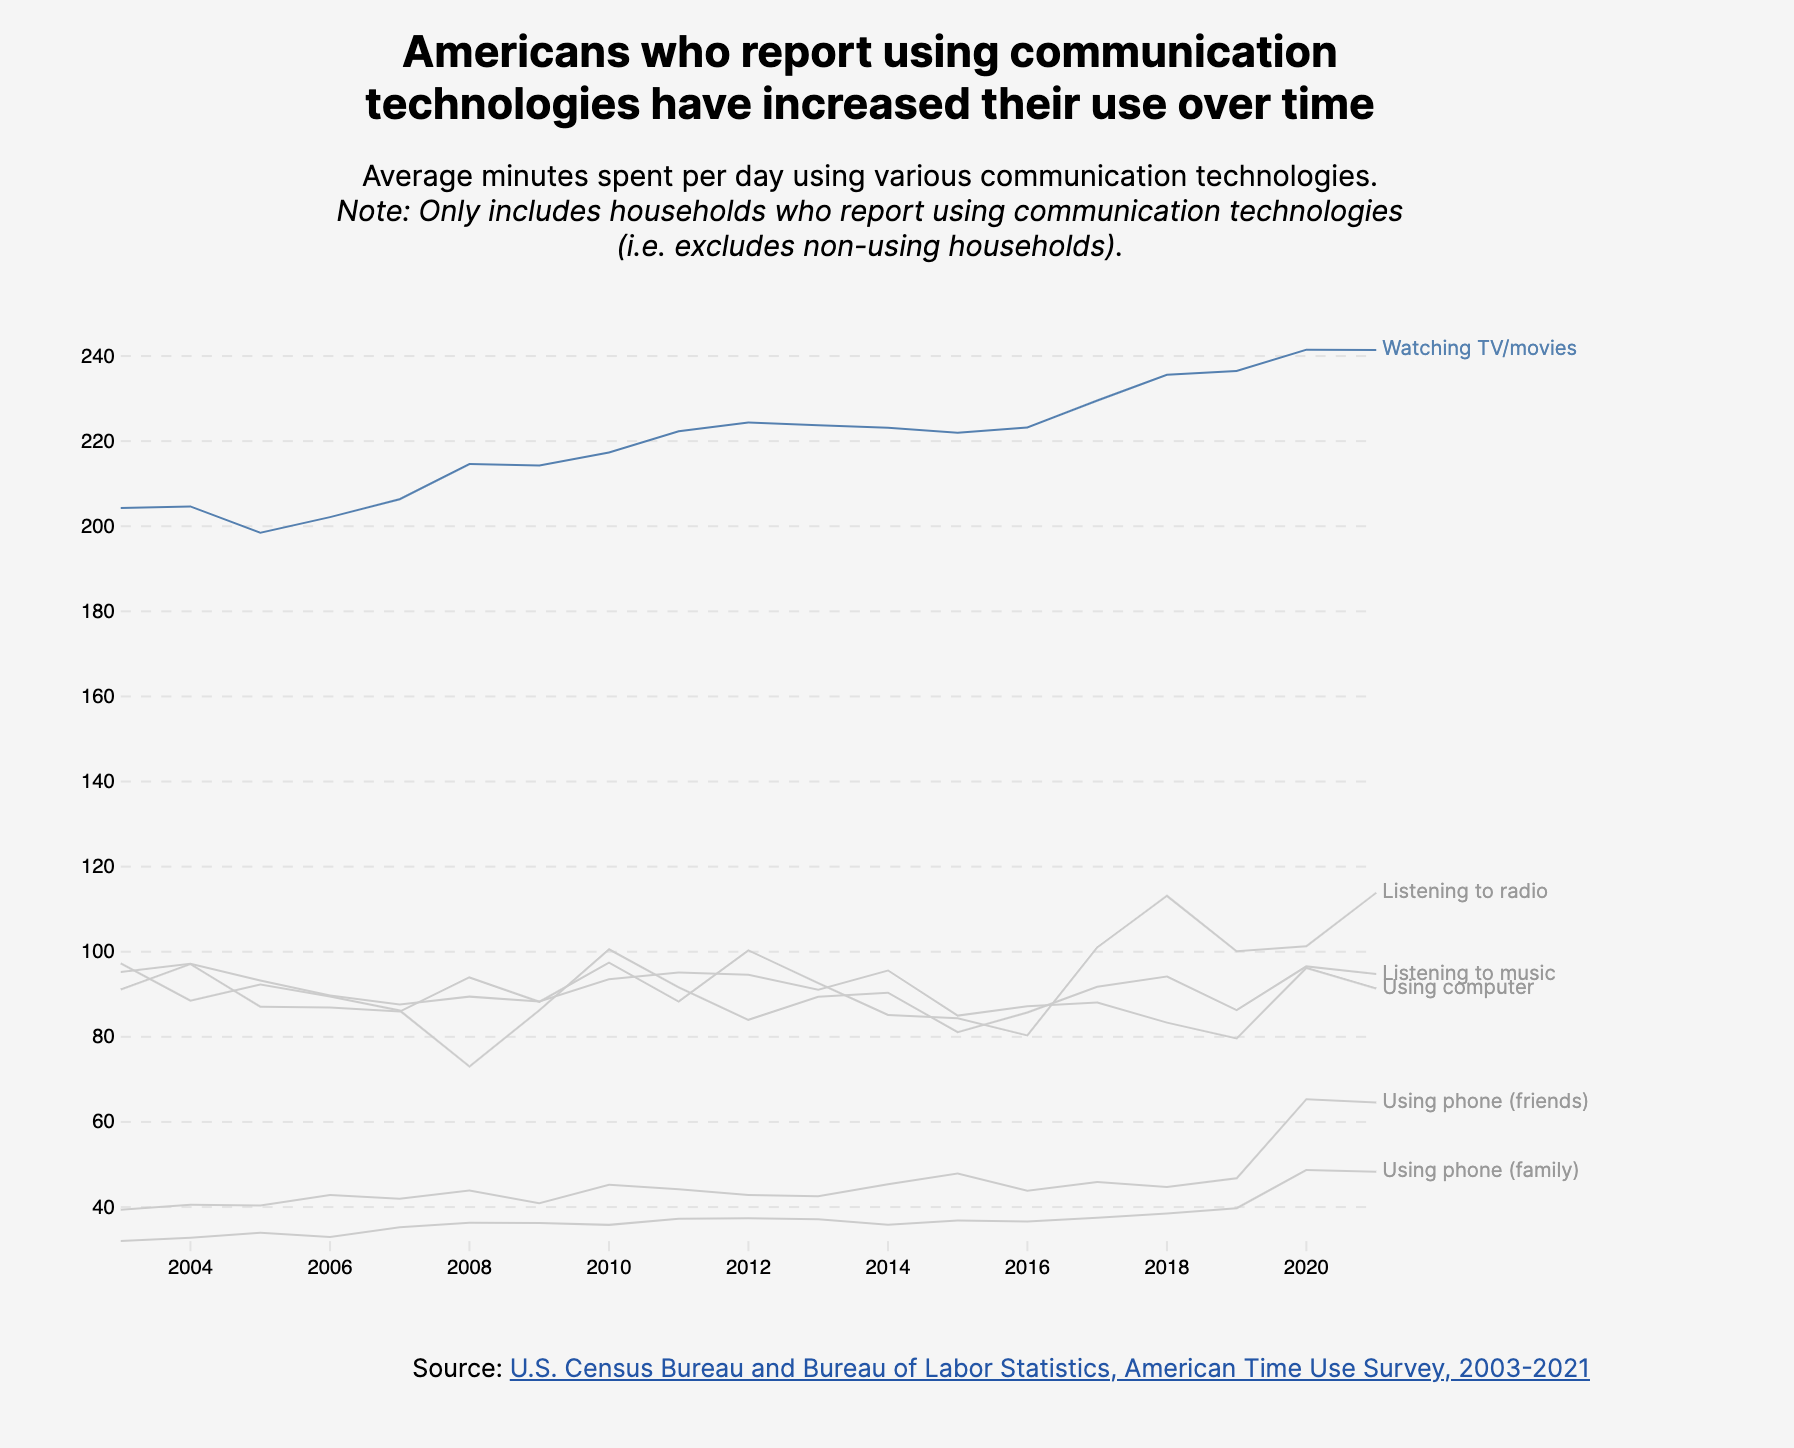
In America’s Communication Identity, Visualized, I visualize technology adoption and use in American households in an attempt to understand the ubiquitous nature of today’s communication technologies. This project was completed as the final course deliverable for CAPP 30239: Data Visualization.
As a consumer of information in the 21st century, I often feel as though new technologies are quickly and consistently being adopted into American households while other technologies become obsolete. Recent technologies like computers, cell phones, and tablets, for example, have been embraced by today’s “information economy” and demand increasingly more of our time and attention.
In formulating my project idea and topic, I considered the following questions:
- How do recent technologies compare to older technologies, in both their rates of adoption and time usage?
- Is the perception that our current technological landscape is ever-changing unique to our time or is it consistent with communication technologies of the past?
- Can this and other perceptions be explained by the rate of adoption, or rather the increase in time usage compared to other technologies?
Visualizations were key to the success of this project. Chart type, interaction, color, and labels were all specially chosen to engage and inform the reader. Time was a universal theme in this project and is likewise present in all visualizations.
To understand how the American population adopts and uses technologies, I used various data collected by the United States Census Bureau and the Bureau of Labor Statistics (BLS). Data on internet access was collected from the Current Population Survey (CPS) and the American Community Survey (ACS). Time use data was collected from the American Time Use Survey (ATUS).
Datasets were accessed and cleaned using R. Visualizations were created using D3.js. Page layout and style were built using HTML and CSS. All data, libraries, and code are stored in this project’s GitHub folder.
Scroll through the final project here. Static screenshots of select visualizations are below.


